How we Scaled waterdrop from $0 to $1M/Month in Under 12 Months

Written by: Alex Cleanthous
Published:
15 Oct 2025
How do you scale an eCommerce business from $0 to $1 Million? It requires more than just growth tactics and demands a structured, disciplined approach. At Webprofits, we follow a proven eCommerce Scaling Playbook we built on one non-negotiable principle:
Scaling happens when customer acquisition becomes predictable, creative is engineered, not guessed, and every decision is guided by ROAS.
Here’s how we do it:
- Lead with a performance-first strategy Nail product–market fit, positioning, and media planning before spending a cent—so every dollar drives growth.
- Launch hard with full-funnel media Go live fast across Meta, Google, and YouTube—aligning creative with buying intent to drive immediate sales.
- Obsess over creative testing Test angles, formats and offers relentlessly to find what scales, and kill what doesn’t.
- Convert clicks into serious revenue Every page, product, and promo was built to maximise conversion and AOV—because traffic without revenue is just noise.
- Make LTV your unfair advantageWe used flows, timing, and segmentation to turn one-time buyers into high-value repeat customers—lowering CAC as we scaled.
This case study shares the actual data, strategy and most importantly, the creative system that turned waterdrop into a million-dollar-a-month eCommerce machine.
Performance Results Snapshot (2023-2024)
| Metric | Result |
|---|---|
| Revenue (Month 12) | $1.1M+ |
| Meta ROAS | 2.8–3.3 (at peak spend) |
| Meta Attributed Revenue | $3M+ |
| Google ROAS | Up to 8.2 (Branded) |
| Email & SMS Revenue | 40%+ of total |
| Repeat Customer Revenue YoY | +167.5% |
| SMS Revenue Growth YoY | +138.6% |
| Popup CVR | 9% (above benchmark) |
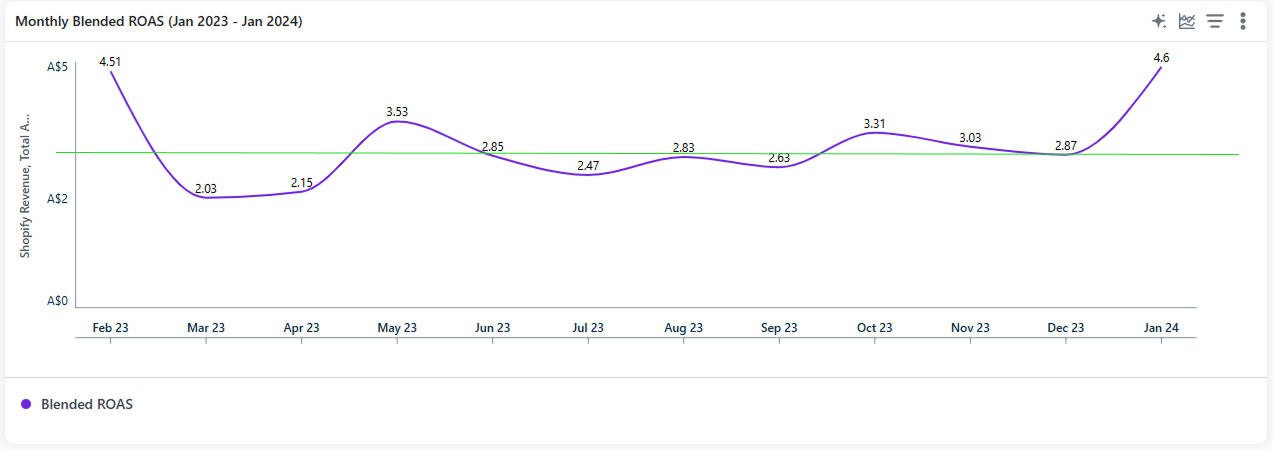
The Golden Rule: Scale at Breakeven (or Better)
Scaling doesn’t begin with volume—it begins with unit economics. Before we scaled, we first identified the breakeven ROAS of 2.85. This number became our north star. If campaigns delivered above that, we spent more. If they fell below, we cut them or rebuilt creative.
- 2.85 ROAS = Go: At or above breakeven, we confidently scaled budgets, knowing repeat purchases and email flows would drive profit on the back-end.
- Data-first scaling: Every ROAS shift was monitored daily to keep scaling momentum without running into loss.
- Profit was back-end loaded: Meta’s role was to acquire customers at scale. Klaviyo and CRO extracted the profit.
Meta Ads: The Performance Core
Meta was not just a channel—it was the foundation of waterdrop’s growth. It was responsible for 80%+ of all customer acquisition.
But Meta’s success wasn’t due to ad spend. It was due to our system for creative development and testing.
“70% of your success comes from the creative itself.”
Jay Assaad, Paid Social Strategist, Webprofits
Our Meta Ads Structure:
- Creative Testing Campaigns: Broad audience + fresh assets, constantly validating new winners.
- Scaling Campaigns: High-performing ads from testing were moved into high-budget campaigns to push volume at target ROAS.
- Advantage+ and broad targeting: Meta’s algorithm is now creative-first, not audience-first.
Performance Highlights:
- Held 2.8–3.3 ROAS even at peak spend months (over $140K).
- Produced over $3M in attributed revenue via Meta alone.
- Built a multi-month creative refresh cadence that sustained momentum.
The Creative Engine: The Real Driver of Scalable Acquisition
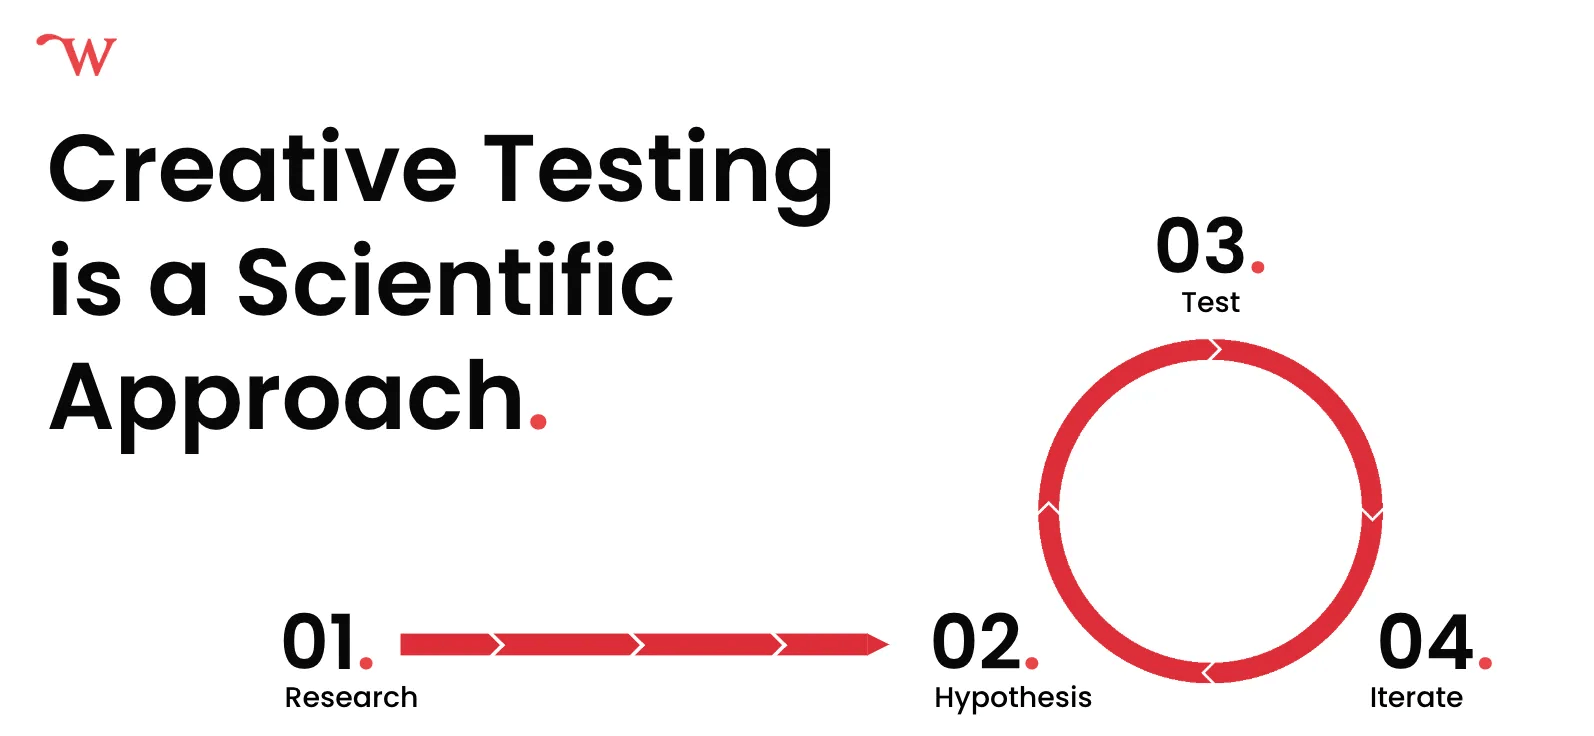
This campaign didn’t scale because of hacks. It scaled because we built a scientific creative system grounded in research, hypothesis, testing and iteration.
“Guessing is not a strategy. Subjectivity can kill marketing and ultimately kill scale. It’s so important that we test things with intention and not just throw things at the wall to see what sticks.”
Jay Assaad, Paid Social Strategist, Webprofits
The Webprofits Creative Testing Framework
Creative isn’t just important, it’s everything. For waterdrop, creative accounted for over 70% of paid social performance. So instead of treating it as a design task, we treated it like a growth engine. At Webprofits, we apply a data-driven, iterative creative framework that scales
performance, not opinions. This means no guessing, no subjective calls and no one-hit wonders — just constant iteration based on what the data tells us is working.
💡 The goal is simple: create fast, test fast, learn fast and scale what works. This is not a campaign. It’s a machine.
Here’s our step by step guide to Creative Scaling:
Step 1: Start with Deep Research
Before we create a single asset, we go deep into the customer’s world. That means mining:
- Product reviews
- Social media comments
- Reddit threads
- Support tickets
- Survey responses
- Competitor analysis
This helps us uncover the pain points, desires, language, and triggers that customers actually respond to — and that fuels the messaging angles behind every ad. We also map our creative approach across the 5 Levels of Market Awareness (from unaware to most aware) to ensure we’re
building assets that meet customers where they are — and move them closer to conversion:
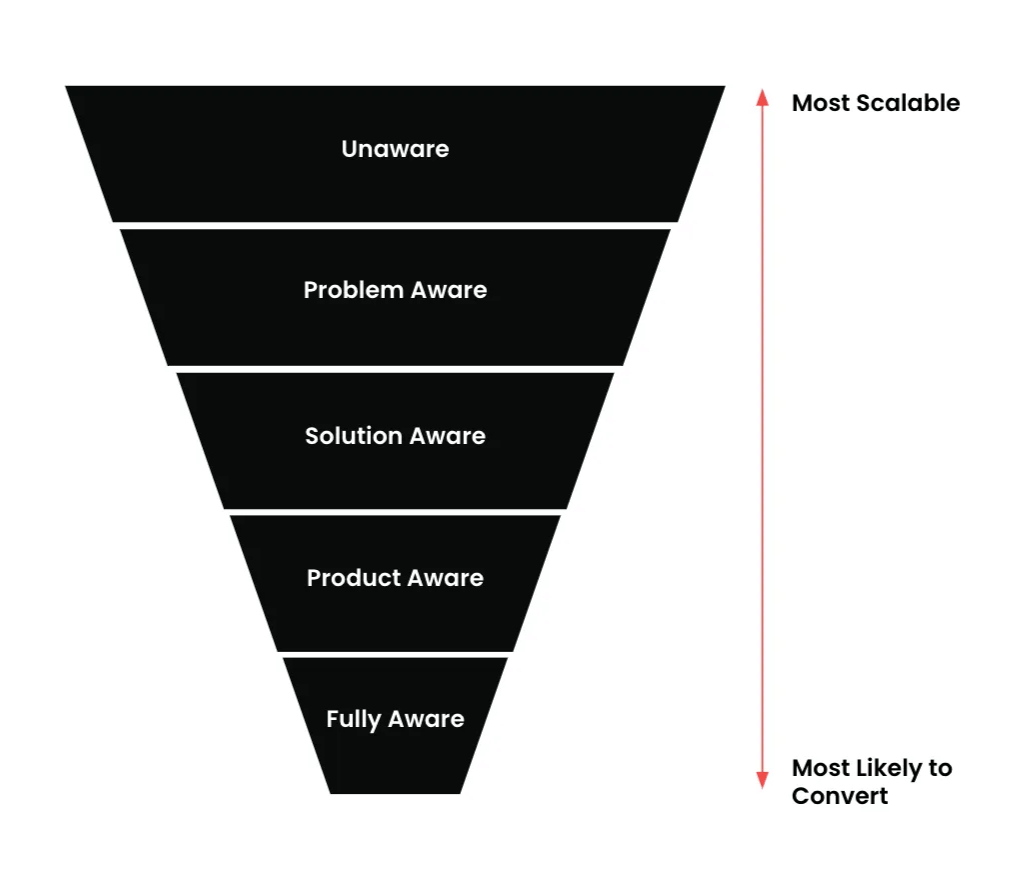
| Market Stage | Audience Knows… | Creative Types Used |
|---|---|---|
| Unaware | Nothing about the problem or you | Educational videos, humorous UGC, influencer storytelling |
| Problem Aware | They have a problem | Founder story, testimonials, tutorials |
| Solution Aware | Solutions exist but not your brand | Us vs them, benefits callouts, comparisons |
| Product Aware | Your product, not full details | Unboxing, “3 reasons why”, user demos |
| Most Aware | All details, just need a push | Offer-led creatives, guarantees, urgency, bundles |
Step 2: Create a Messaging Hypothesis
We don’t just throw hooks at the wall and hope for the best. We form a clear hypothesis like:
“Focusing on dehydration symptoms will resonate most with uni students and drive higher CTR.”
This gives us a lens to test creative intentionally, not randomly — and it helps us measure success clearly.
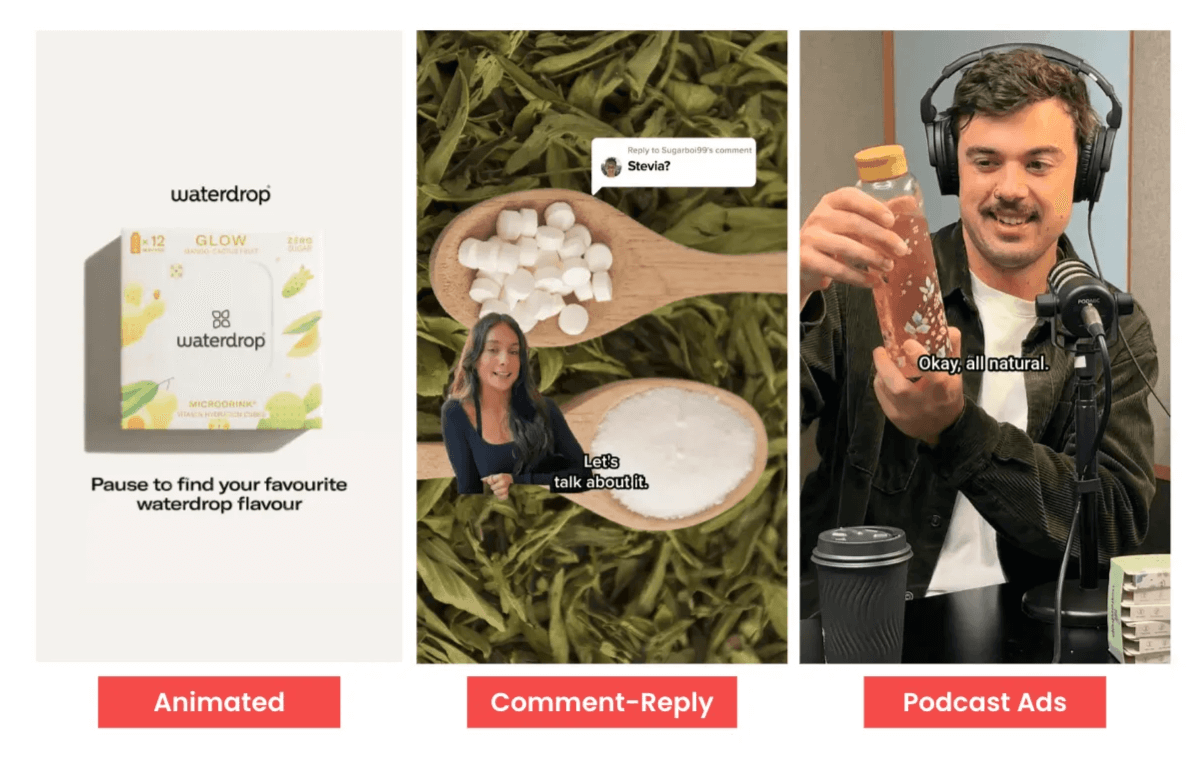
Step 3: Test the Hypothesis with Multiple Formats
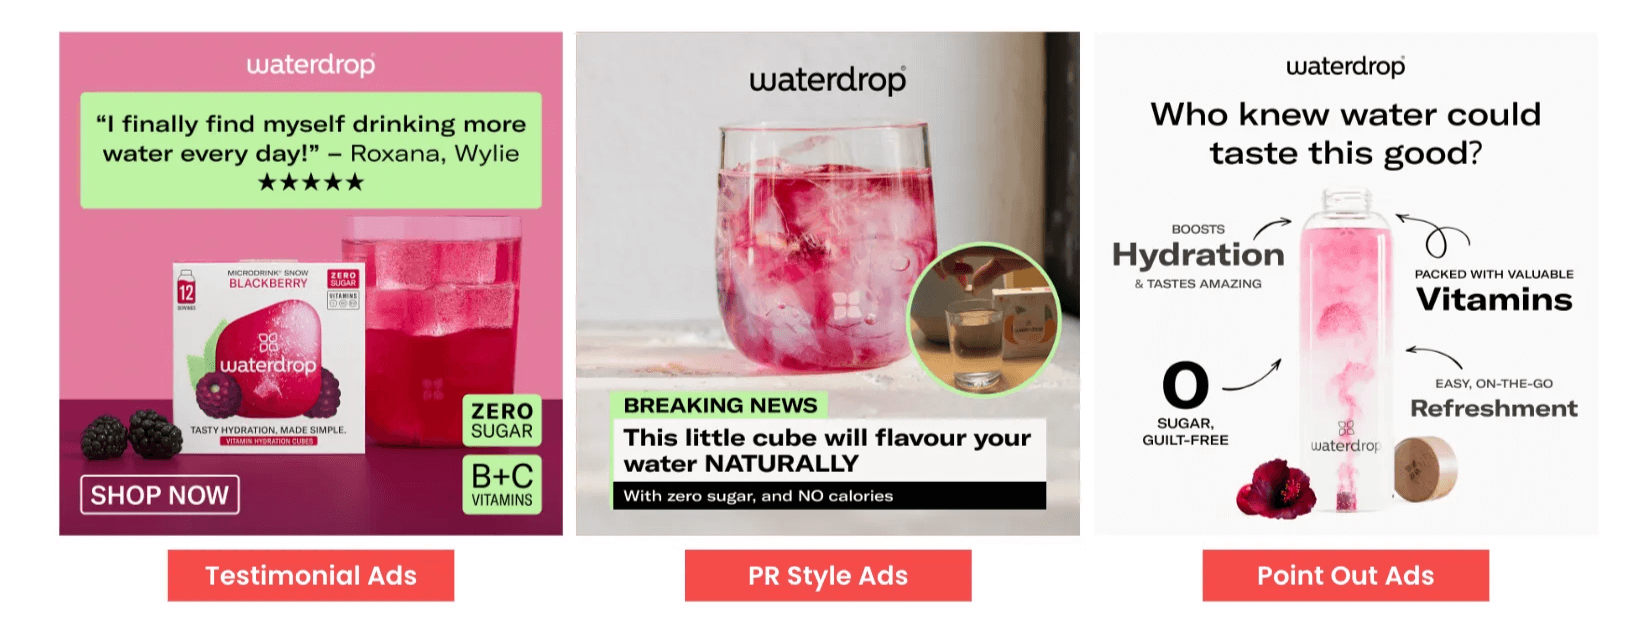
We take that angle and build out multiple creative formats:
- UGC video
- Testimonial static
- Carousel listicle
- Comment/reply video
- Animated explainer
- PR-style image
Same message, different styles so we can see what format delivers the best results per audience type.
Step 4: Isolate the Variables
When an ad performs well, we don’t guess why: we test for it. To find the real driver behind a winning ad, we use a controlled testing approach that isolates one variable at a time. For example, let’s say this is a top performing ad:
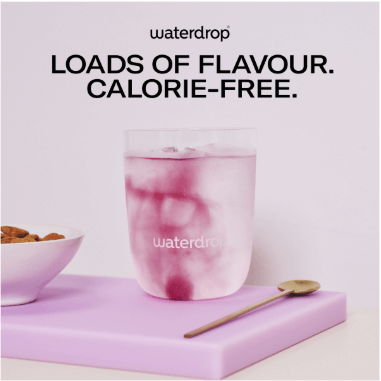
To accurately determine what’s working, we start to isolate the headline and image variables, so we generate three new creatives to test, keeping the image the same and test three different headlines. eg:
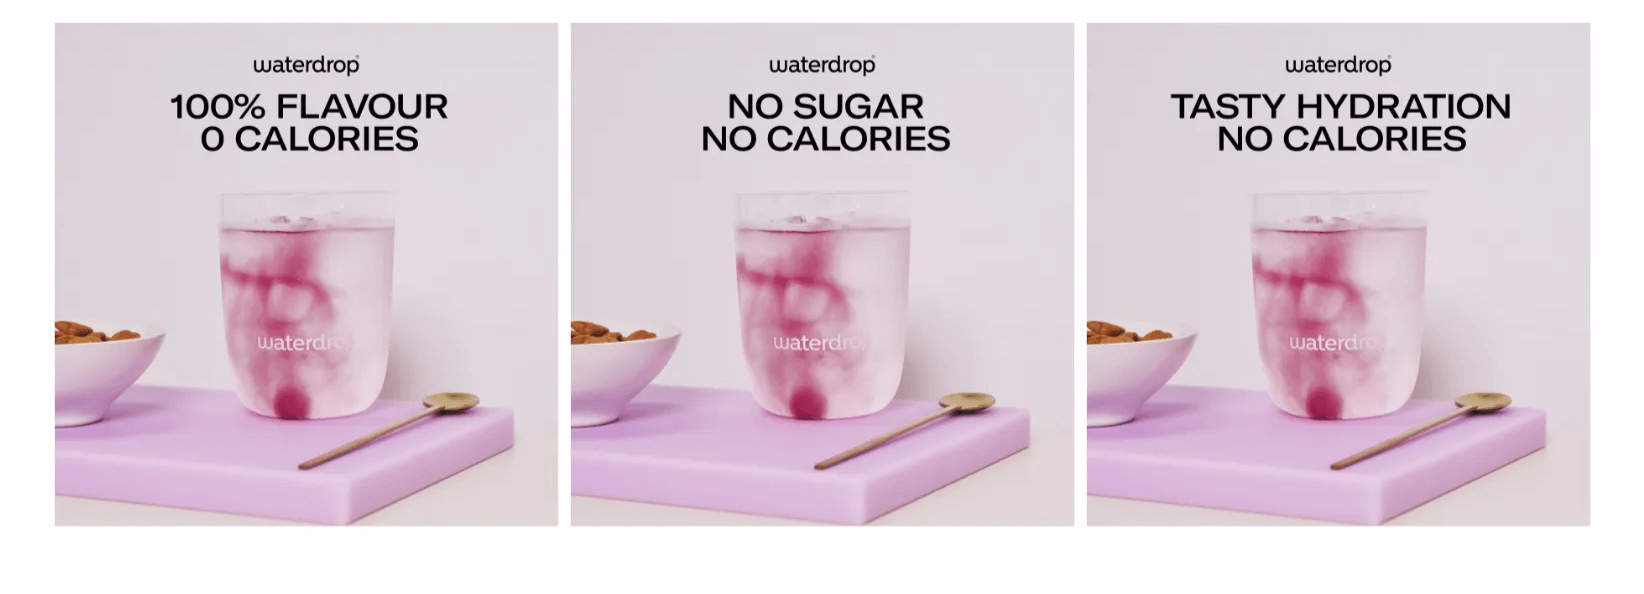
If all variations perform well, the image is likely the winning factor. Then, we flip it: keep the winning headline, test different images:
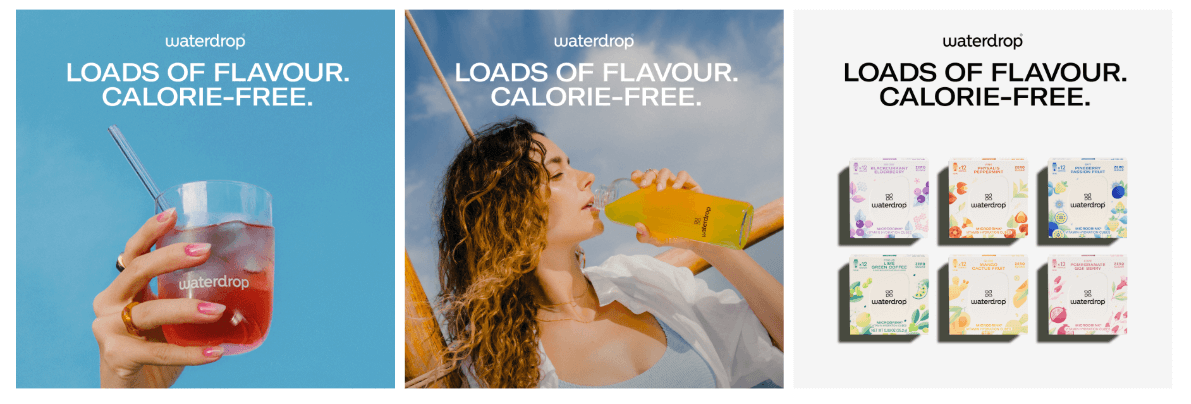
If all those perform, the headline is what’s driving success.
💡 This process removes subjectivity and allows us to identify the exact element that’s driving performance then build new variations around it to scale faster.
Step 5: Iterate Fast and Scale
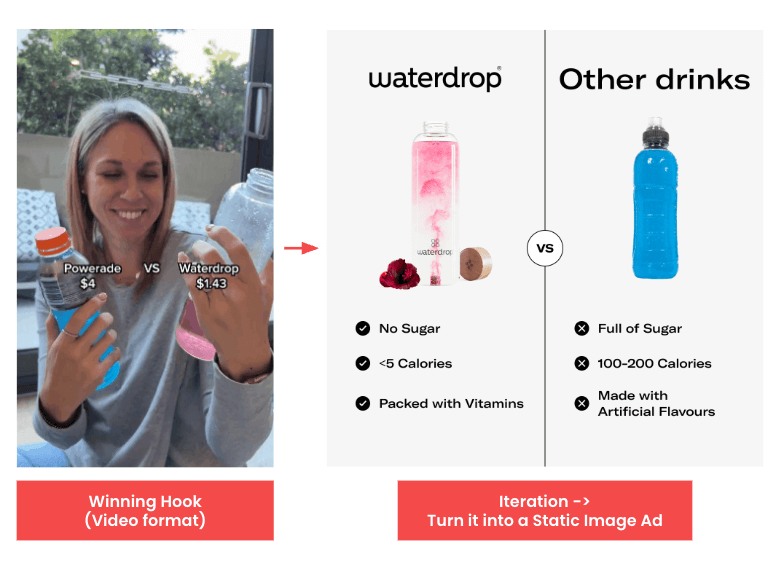
Once we’ve found a winner we don’t sit on it, we double down fast:
- Turn a winning video into static or carousel versions
- Launch hook variants to boost longevity
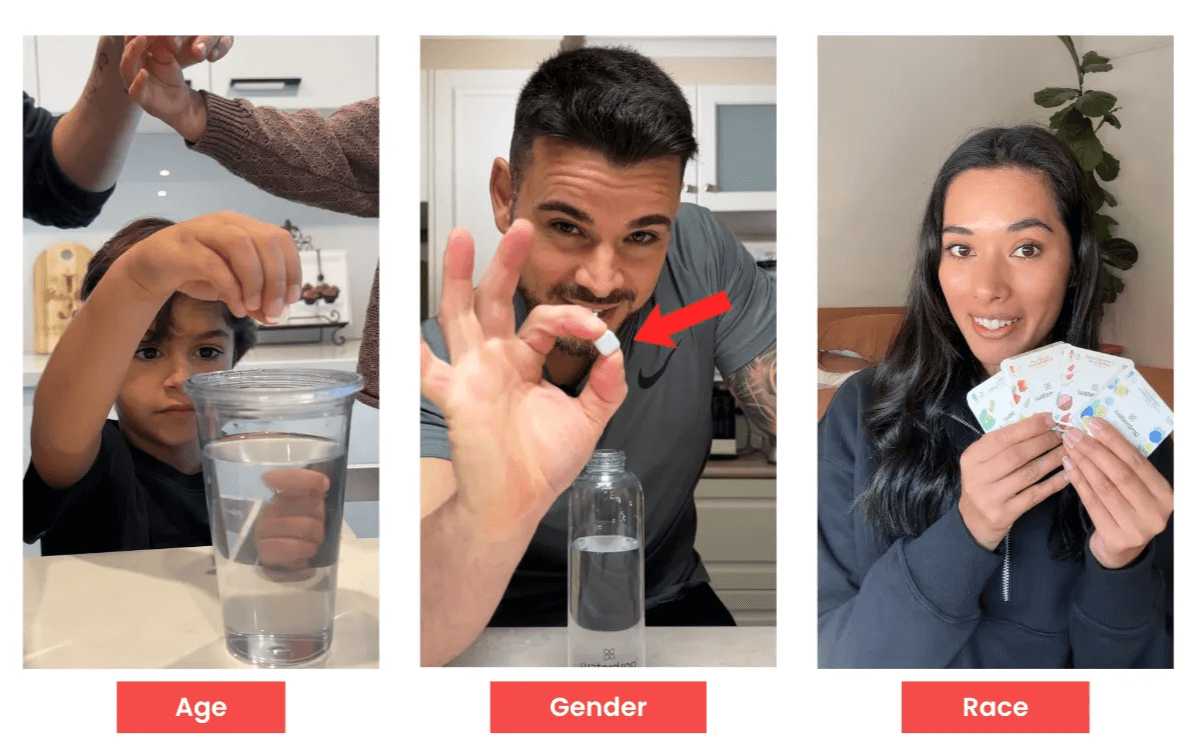
- Adapt copy for different audience segments
- Test different age, gender, and demographic visual cues
We repeat this loop continuously:
Research → Hypothesis → Test → Isolate → Iterate → Scale
This cycle gives us a pipeline of high-performing creative assets ready for scale — and helps us maintain ROAS as budgets grow.
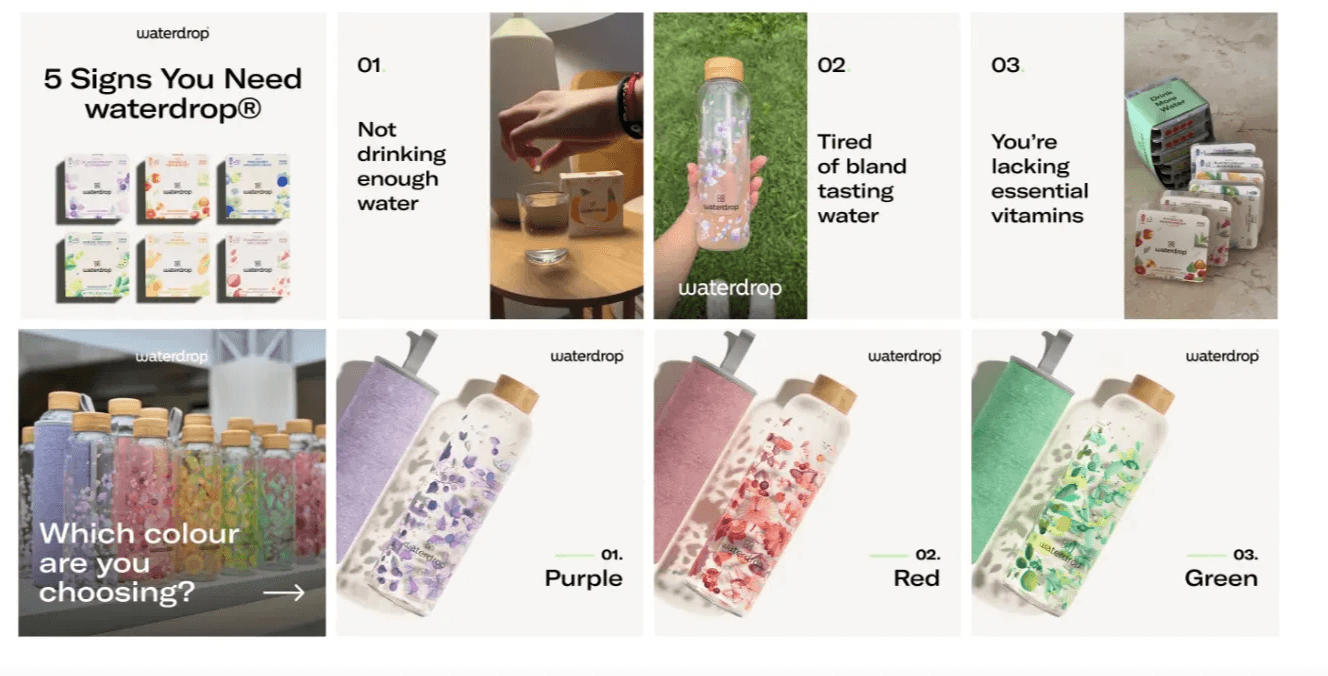
Creative Diversity: How We Reach More People (More Effectively)
One creative format won’t scale. To reach the full potential of your target audience, you need creative diversity, not just in formats, but in what and who you show.
- Formats: video, static, carousel, UGC, animation
- Visuals: age, gender, race, product angle, setting
- Hooks: emotional, problem-solution, lifestyle, functional
- Style Examples:
- Podcast-style ads (performed natively on Meta)
- Comment-reply videos (felt authentic and low-production)
- PR headlines and “newspaper” layout statics
- Testimonial text overlays with branded visuals
“If you’re not using carousels, you’re leaving 15% of scale on the table.”
— Jay, Webprofits
For waterdrop, here are some of the creative diversity tactics we implemented:
- Changing the first 3 seconds of a video to capture attention:
- Repurposing winning videos into static images or carousels
- Varying ad elements like audience demographics, visuals, or sequencing
- Ensuring creative diversity to target new audience pockets and prevent fatigue
🔥 Get access to our Creative Scaling Playbook where we break down the essential creative assets every eCommerce brand should be testing.
And if you want to learn more about our Creative Scaling approach, check out our Fuelling Fast Growth Masterclass with Meta
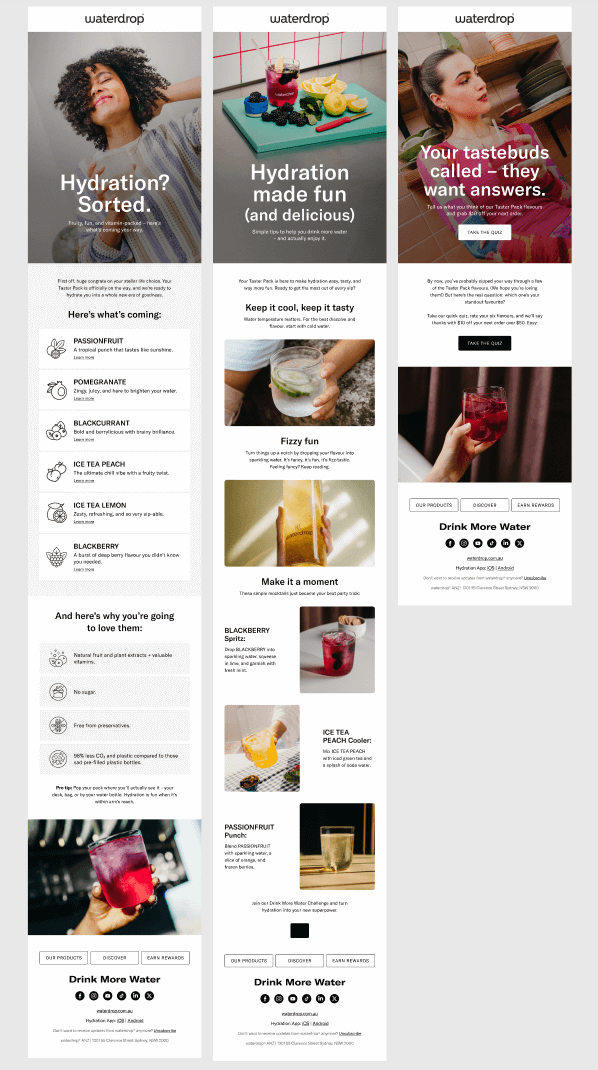
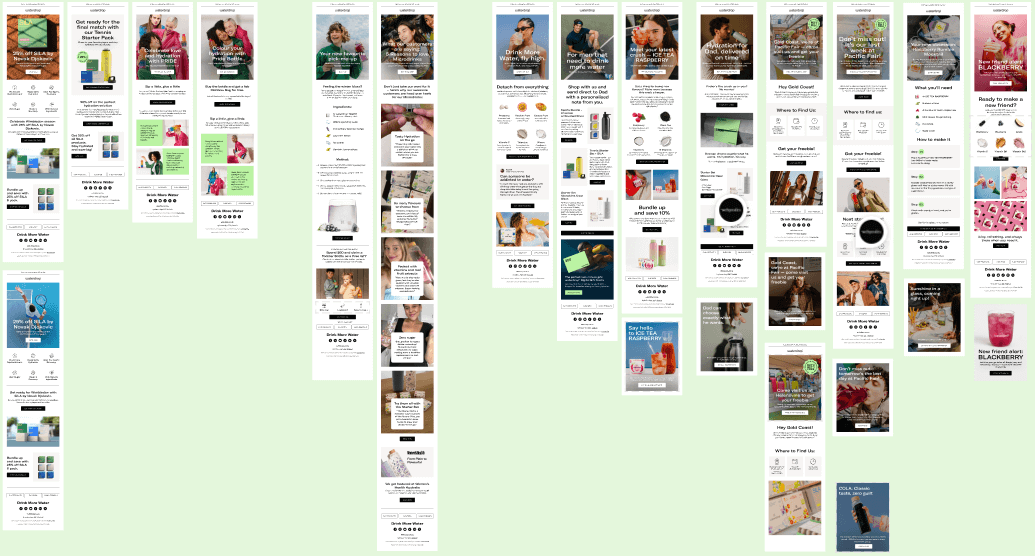
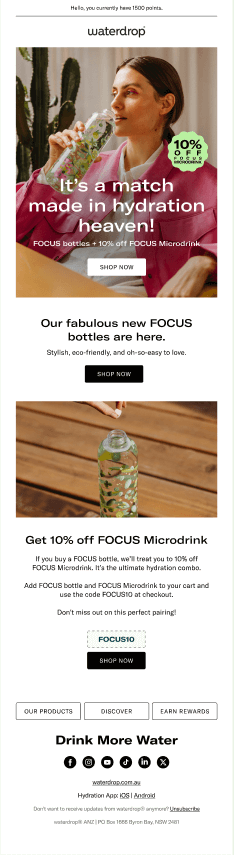
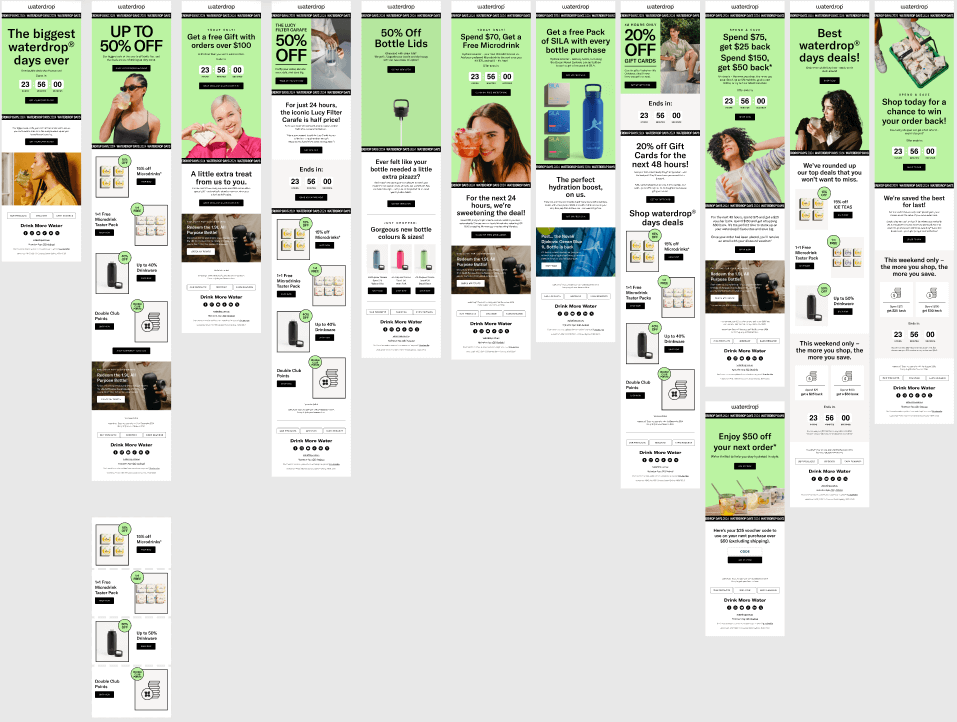
Top Creative Highlights:
Here is a sneek peek at some of the top performing creatives for waterdrop, having generated more than $3M in revenue.
(click the videos to play)
Strategic Summary:
- Meta Ads Mastery is Critical. Brands seeking to scale DTC revenue need to master Meta Ads as the primary channel for creating demand.
- Creatives are the #1 most important lever for success in paid advertising.
- Creative Testing is an Essential Ongoing Process. Continuous testing and iteration are essential for scaling and maintaining performance as budgets increase.
Capturing Demand with Google Ads
While Meta Ads took centre stage for demand creation, Google Ads played a critical supporting role in the waterdrop growth engine, not by generating awareness, but by capturing intent at the moment it mattered most.
💡 The goal wasn’t to build an empire on search. It was to harvest the demand created upstream — efficiently, and without overspend.
The Strategy: Prioritise Profit-First Capture, Then Layer in Scale
We took a structured, ROI-focused approach to Google Ads built on three essential components:
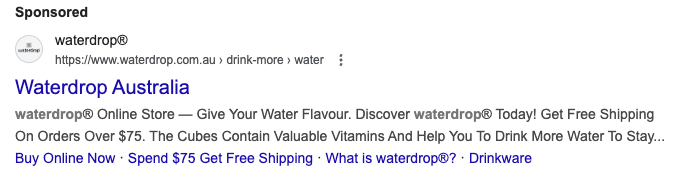
- Branded Search CampaignsThese ensured we owned our name across every device, every query. No competitor bidding. No lost demand. High intent, low cost, simple win.
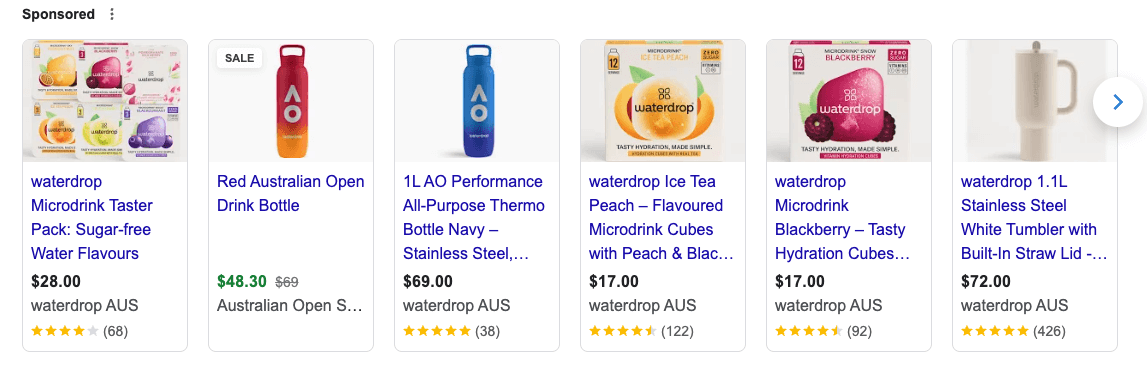
- Performance Max (PMax) CampaignsWe used PMax not as a one-size-fits-all blunt instrument, but as a focused distribution engine for our bestselling SKUs. The aim was to get high-converting products in front of bottom-funnel buyers across Search, Shopping, Display and YouTube automatically.
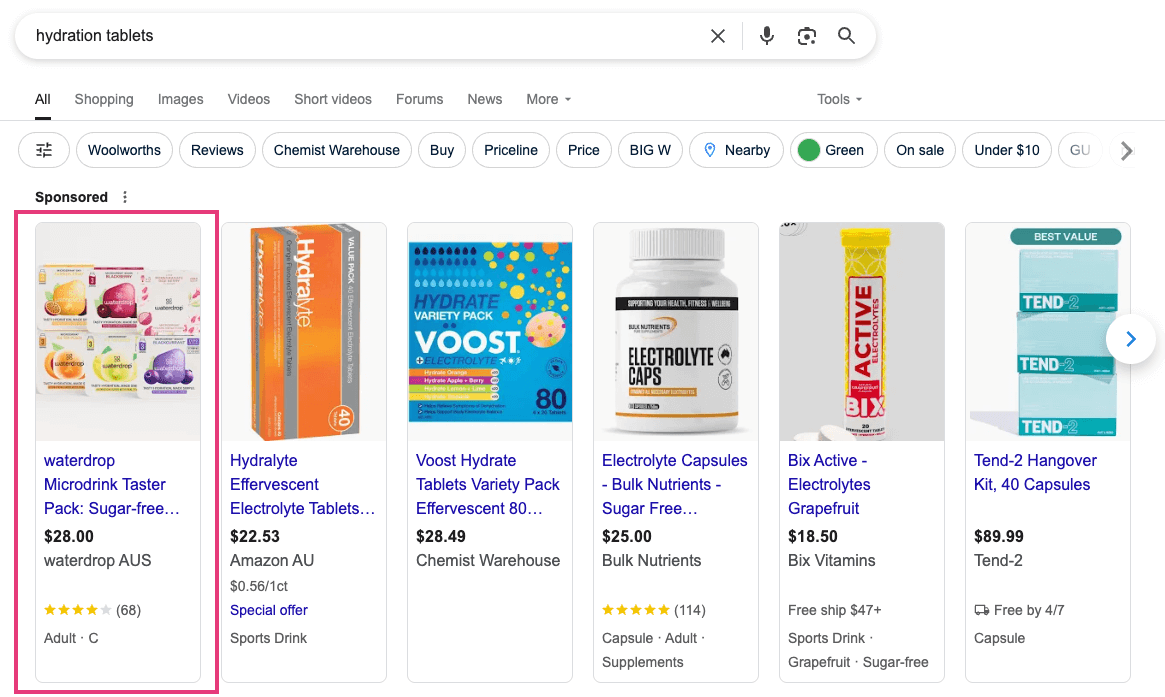
- Non-Branded SearchWhere search volume existed (e.g. hydration tablets, electrolyte drinks), we expanded into high-intent, non-brand terms, but only after performance benchmarks were met through brand and PMax. No guesswork. No waste.
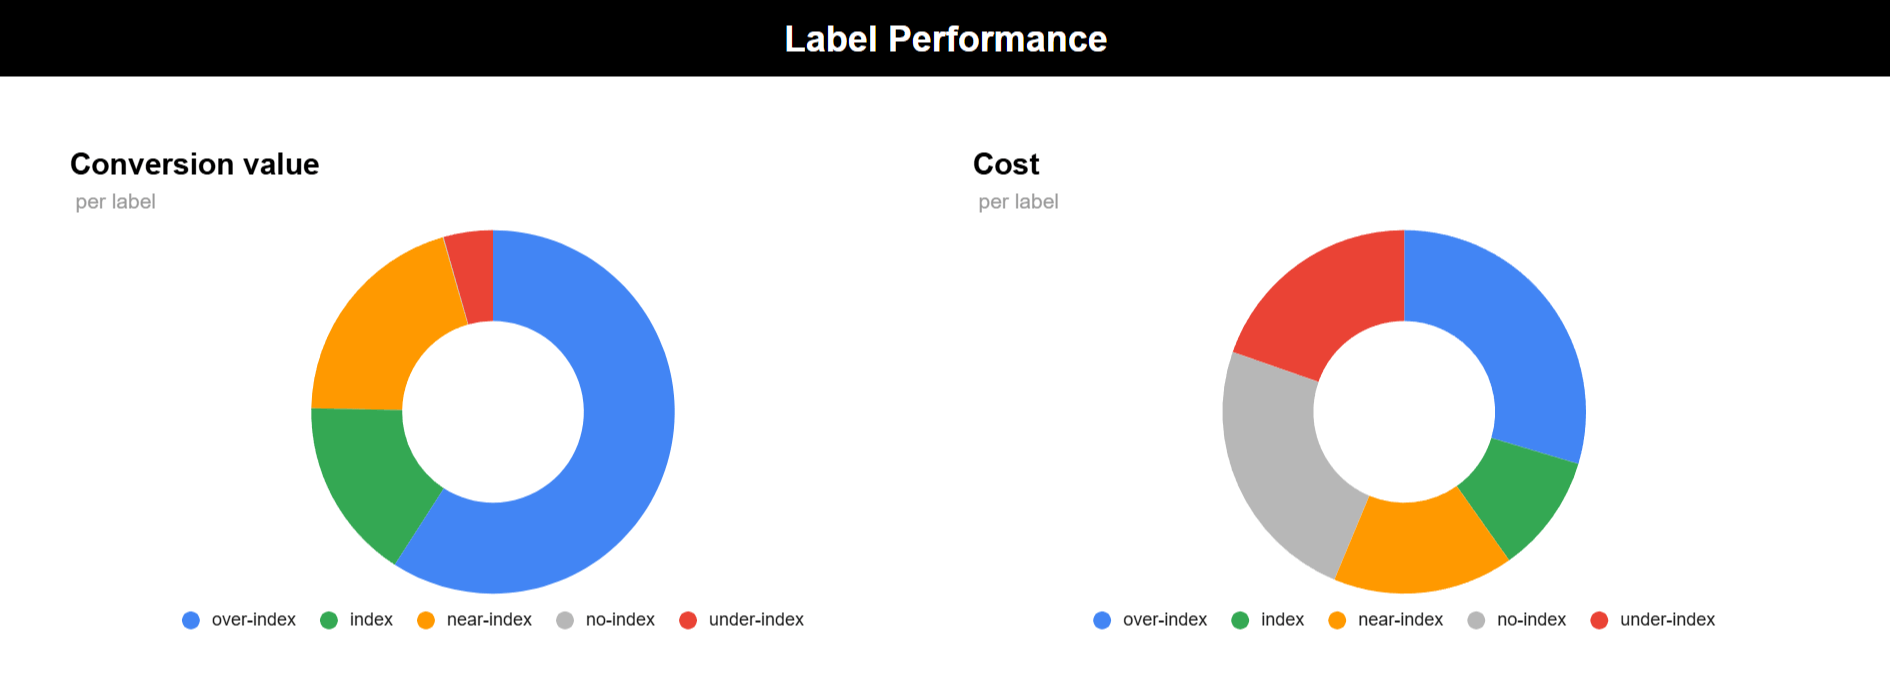
Advanced Tactics: Flowboost for Smarter Automation
To push performance further, we implemented the Flowboost Labelizer Script, a custom automation that dynamically re-categorised products based on real-time ROAS thresholds. This allowed us to:
- Allocate more budget to high-performing products
- Suppress low-performing or low-impression items
- Keep Performance Max lean, adaptive and ROI-positive
This added a layer of intelligence that’s typically missing in default PMax setups, turning a black box into a controllable lever.
Why It Worked
Unlike Meta, where creative and audience are the variables, Google Ads success depends on intent alignment, product structure and bidding discipline. By limiting the scope to the campaigns that drive the highest purchase intent, and automating performance feedback loops, we avoided
the bloated, low-efficiency trap that kills most Google strategies. We didn’t overspend. We didn’t guess. We captured what we created — and made every search click count.
PMax was a key driver of success due to its unique ability to scale across multiple Google inventory channels with a single, goal-based campaign. Here’s how it supported the account’s growth:
Unlocked Incremental Demand Traditional search campaigns were were performing well, but they primarily captured existing demand. Performance Max allowed waterdrop to reach potential customers in discovery phases across YouTube, Display, Gmail, and Discover. These channels introduced
the brand to new audiences who were not actively searching, but who fit high-value behavioural profiles.
Feed Optimisation An optimised product feed allowed the campaign to dynamically match high-performing products with user intent across the various channels. Smart segmentation and product exclusions ensured that the focus remained on bestsellers and high-margin items.
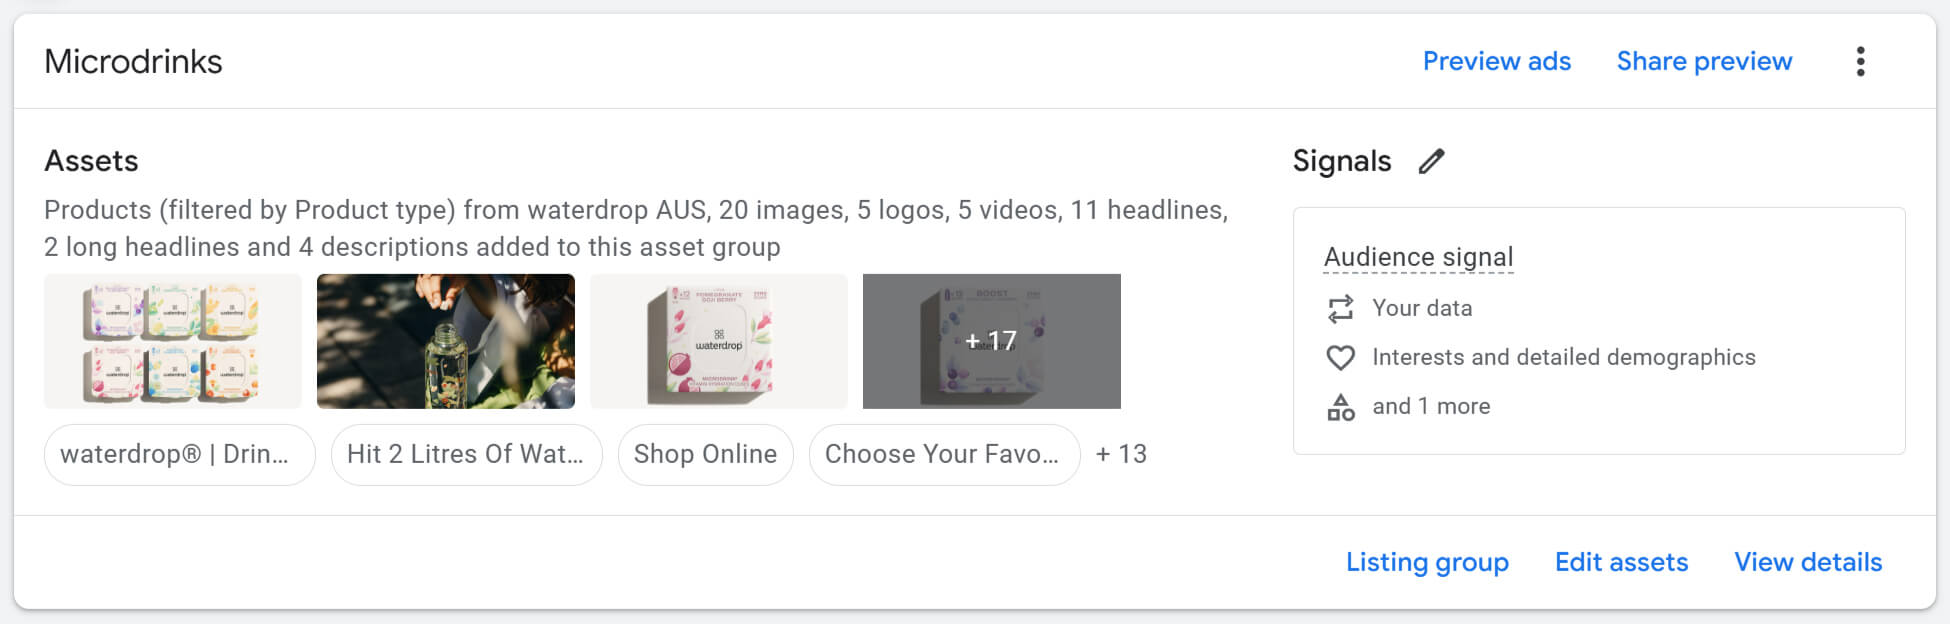
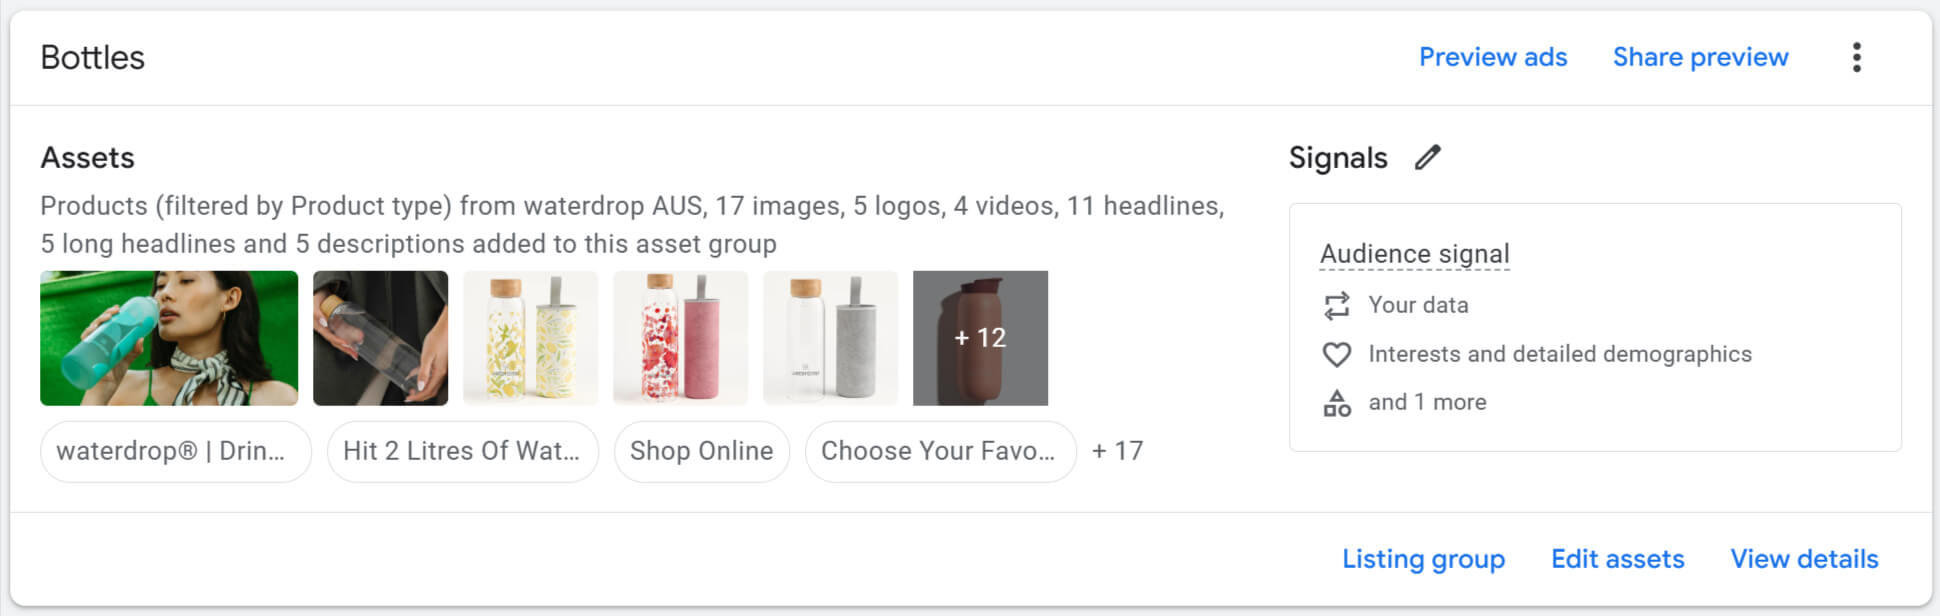
Creative Variety PMax’s ability to test multiple creative formats was critical. Asset groups were tailored to different personas (e.g., health-conscious individuals, sustainability-focused buyers), which increased engagement and improved conversion rates. Creative insights from the
asset performance reports were used to continuously refine messaging and visual assets.
Performance Highlights:

PMax became a high-margin, low-management workhorse, delivering critical incremental profit.

ROAS ranged from 4.5–8.2 for Branded campaigns and 2.5–3.2 for PMax
Strategic Summary:
- Google Ads is for capturing demand, not creating it. Pair it with Meta Ads for a complete funnel strategy.
- Start simple: Branded search, Performance Max with bestsellers, and optionally high-intent non-brand search.
- Use automation with intent: Scripts like Flowboost Labelizer improve efficiency and remove guesswork from Performance Max.
- Don’t chase scale here, chase profitability. Spend is capped by search volume, not budget. Maximise what’s already searching for you.
- Measure accurately: Attribution software like Triple Whale ensures Google gets credit only where credit is due, protecting budget allocation across the entire media mix.
Maximising Customer Lifetime Value Through Email & SMS
While Meta Ads powered waterdrop’s customer acquisition, Klaviyo email and SMS were instrumental in driving retention, lifetime value and overall profitability. Together, they formed the backbone of a sustainable scaling strategy, turning first-time buyers into loyal, repeat
customers.
Customer Lifecycle Strategy Built to Scale
From day one, Webprofits implemented a robust lifecycle framework, anchored by three core automated Flows:
- Welcome Series: Warm-up emails to convert new subscribers into customers.
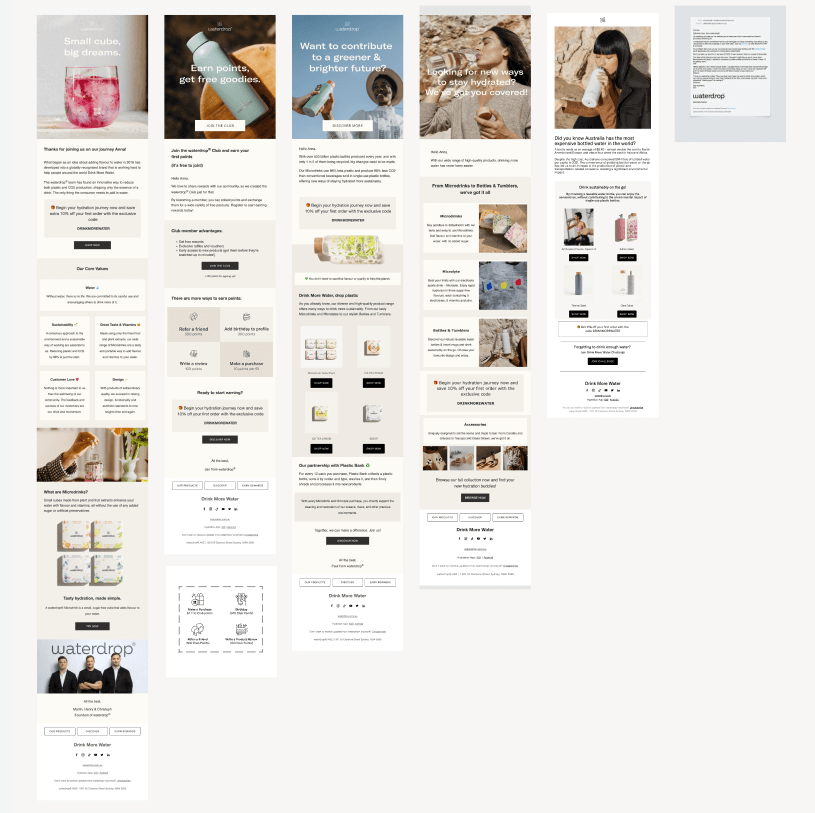
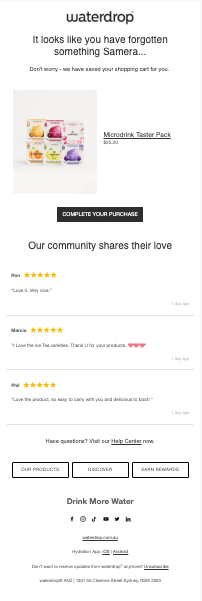
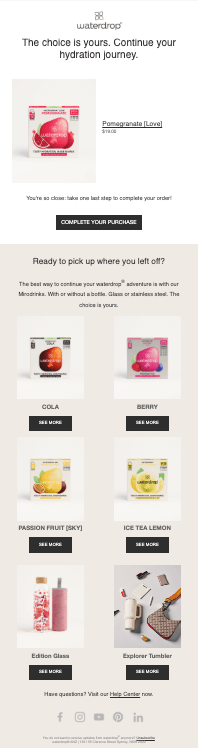
- Abandoned Cart: A multi-touch sequence to recover lost sales.
- Post-Purchase Flow: A mix of support, education and upsell prompts to drive repeat purchases.
Each Flow was built with conversion psychology, brand tone and consumer journey mapping in mind, not just to convert but to deepen the relationship over time.
🔥 Access our Email Flows Playbook for a deep dive into the 26 essential Email & SMS Flows every eCommerce brand needs to scale, convert and grow without extra ad spend. No fluff. Just proven tactics.
Campaign Cadence That Converted
With the three key Flows having been set up to drive revenue on autopilot, beyond automation waterdrop maintained a consistent email and SMS campaign calendar. This included:
- Monthly promotions to stimulate urgency and drive volume
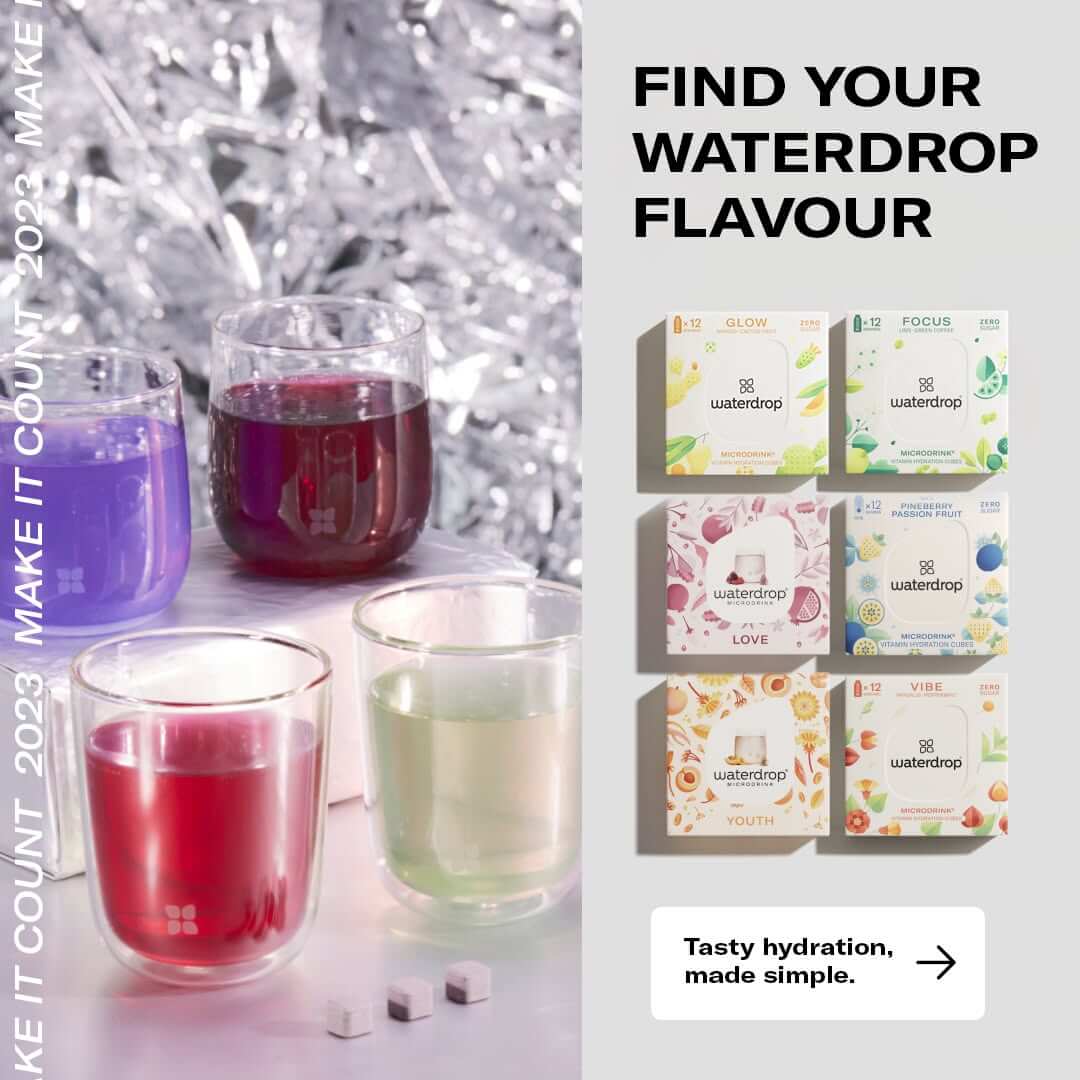
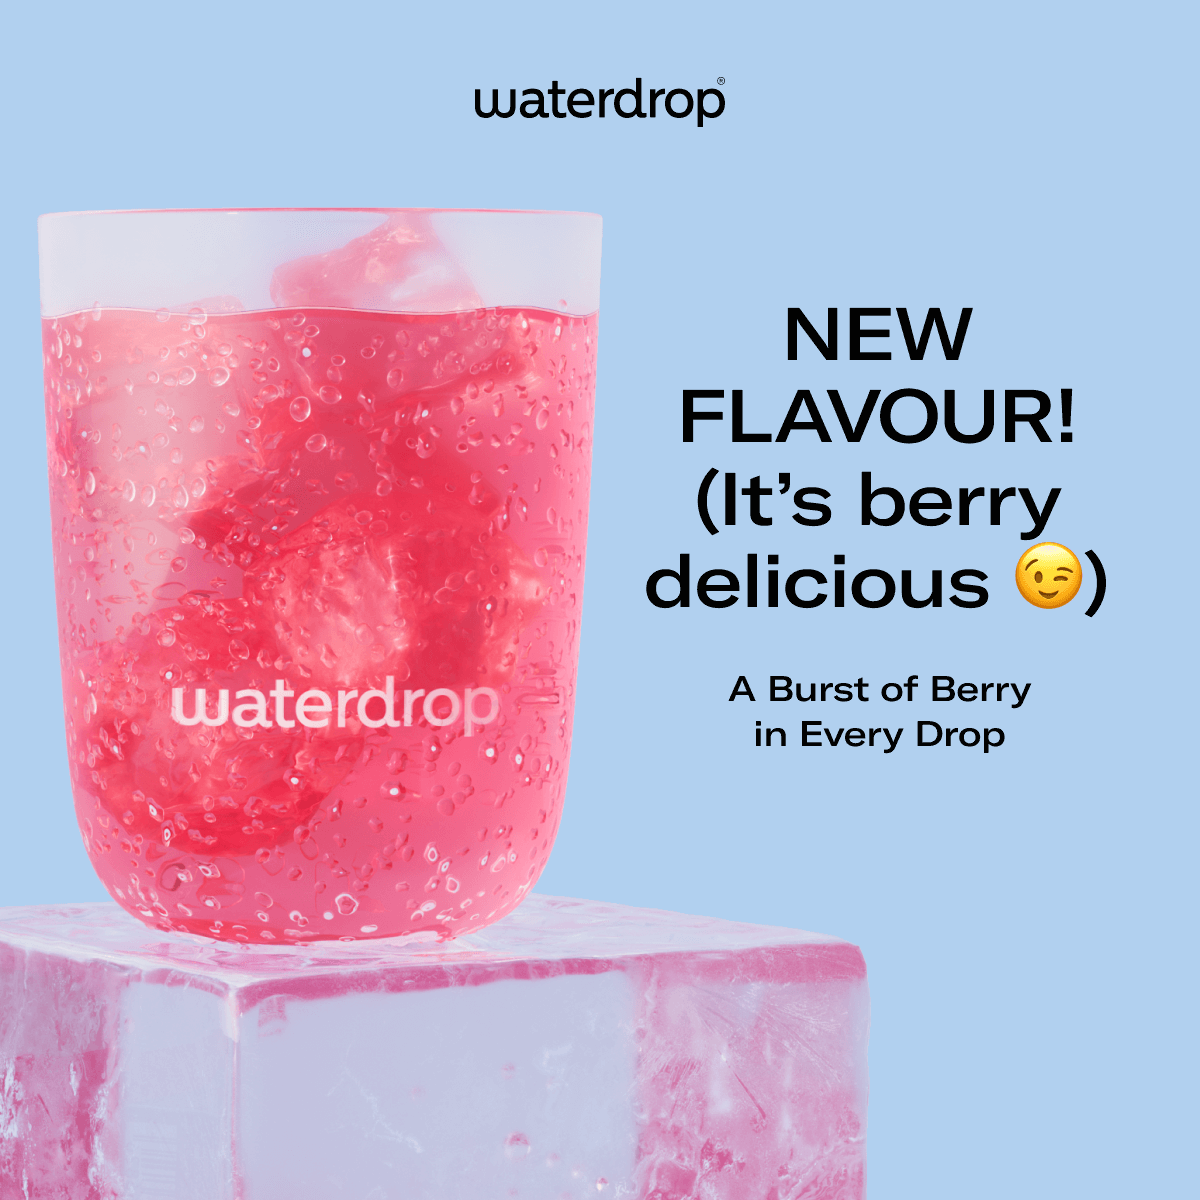
- Product drops and flavour releases to re-ignite interest
- Seasonal stories, tips and community-driven content to maintain engagement
Strategically timed sends and aggressive segmentation ensured deliverability stayed strong; a critical factor following Gmail and Yahoo’s 2024 deliverability rule changes. Bounce management, spam suppression, and re-engagement Flows were tightly managed to keep lists healthy and responsive.
Lifecycle in Action: Fuelling the First $100K Day
waterdrop’s Black Friday launch in 2024 showcased the power of lifecycle marketing in action. In the lead-up to BFCM:
- Audiences were “primed” via teaser-style emails and social content 24 hours before launch
- Full-funnel email and SMS sends supported the campaign from day one
- Creative diversity across formats (GIFs, text-based images, UGC-style videos) kept engagement high
THE RESULT? waterdrop’s first-ever $100,000 revenue day on Day 1 of BFCM, doubling the previous year’s single-day record.
The 20% Rule (and Then Some)
With key Flows in place, coupled with strategic campaigns, Email and SMS consistently drove over 20% of monthly revenue, serving as the profit engine behind customer acquisition. With consumable products and a healthy LTV:CAC ratio, lifecycle became the lever that turned “breakeven” acquisition into
long-term profitability.
Strategic Summary:
Meta acquired the customer. Email and SMS made them profitable.
Beyond ROAS: The Attribution System That Made Scaling Profitable (and Predictable)
Most brands make high-stakes decisions based on guesswork. But if you’re not confident where to place your next dollar, you’re risking scale without control. At low spend, you can get away with gut feel and platform data. At high spend,
attribution isn’t optional,
it’s critical. Without it, you end up scaling the wrong campaigns, trusting inflated results and capping growth because the data youre using is inaccurate or incomplete. That’s why for waterdrop, attribution became the foundation of every budget decision, campaign kill and creative scale-up.
“The wrong insight is worse than no insight… it pushes you in the wrong direction faster.”
— Jay, Webprofits
How We Solved Attribution for Waterdrop
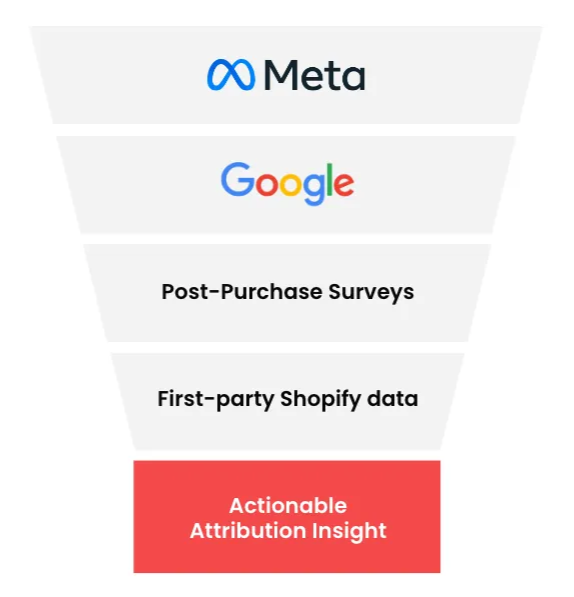
1. Implemented Triple Whale as a Source of Truth
We connected Shopify, Meta, and Google into Triple Whale and deployed:
- Full CAPI and pixel integration
- Post-purchase surveys asking “Where did you first hear about us?”
- Cross-channel revenue matching via Total Impact attribution
This gave us a clear, cross-platform view of performance that finally matched what Shopify reported.
2. Rebalanced Channel Credit Using Survey Data
Meta was often under-credited due to tracking restrictions, while Google (operating on last-click) took credit for many purchases it didn’t initiate. Using post-purchase survey responses, we adjusted weighting: If a customer said “Facebook” but converted via Google, we attributed credit to Meta.
This kept Meta’s contribution accurate and justified continued scale.
3. Platform vs. Reality: A Layered Attribution Model
Each platform tells a different story:
- Meta uses 7-day click / 1-day view: great for visibility, not precision
- Google uses last-click: perfect for closing credit, terrible for top-of-funnel
- Klaviyo uses multi-touch: great for LTV, not acquisition
We didn’t choose one — we used them all, triangulating the truth with Triple Whale:
- Total Impact: Our primary benchmark for ROAS + budget allocation
- First Click: For identifying top-of-funnel winners
- Last Click: For analysing conversion triggers
- Triple Attribution + Meta Views: For non-click influence
- New vs. Returning ROAS: To ensure we were driving growth, not just retargeting
4. Creative-Level Attribution
We didn’t just measure by channel. We tracked ROAS by creative ID to identify which ad hooks, styles, and formats drove purchases. By combining platform-level results with survey data, we could confidently iterate and scale what was working creatively, not just what the platform
thought was working.
5. Decision-Making Hierarchy
We established a clear attribution-driven workflow:
- Platform ROAS = short-term optimisation
- Triple Whale ROAS = budget & growth planning
- Survey attribution = creative and messaging strategy
WHAT WE LEARNED:
- If we had relied solely on Meta’s reported ROAS, we would’ve underspent by 40–50%
- Google over-attributed itself by ~25%, which could have led to wasted budget
- Post-purchase surveys gave us qualitative feedback that influenced landing pages, creative angles, and customer messaging
- Attribution software isn’t about perfect accuracy, it’s about directional clarity so we could make confident decisions at scale
Strategic Summary
Attribution wasn’t a reporting tool. It was the scaling safeguard that let us confidently push six figures in Meta spend knowing we were seeing the real return.
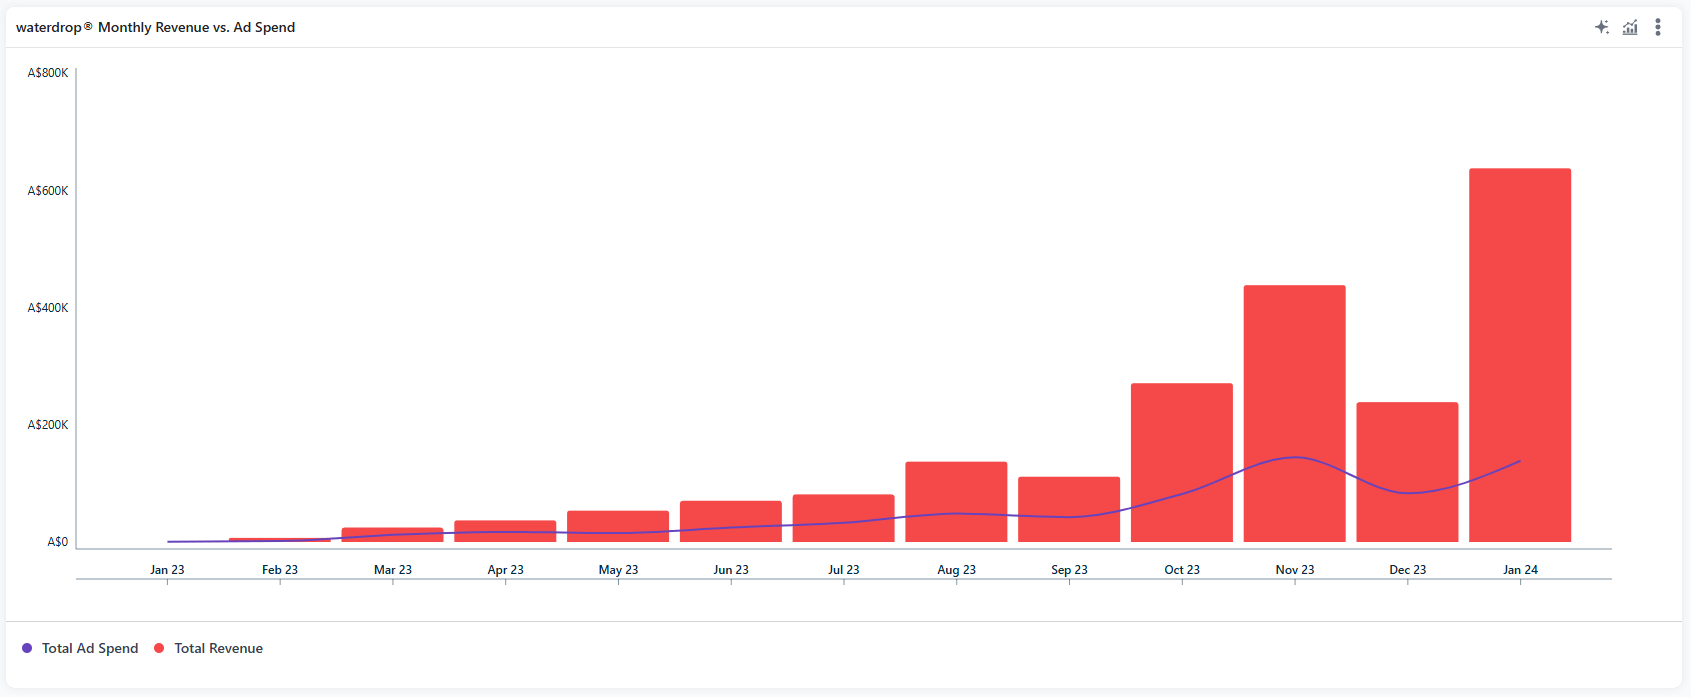
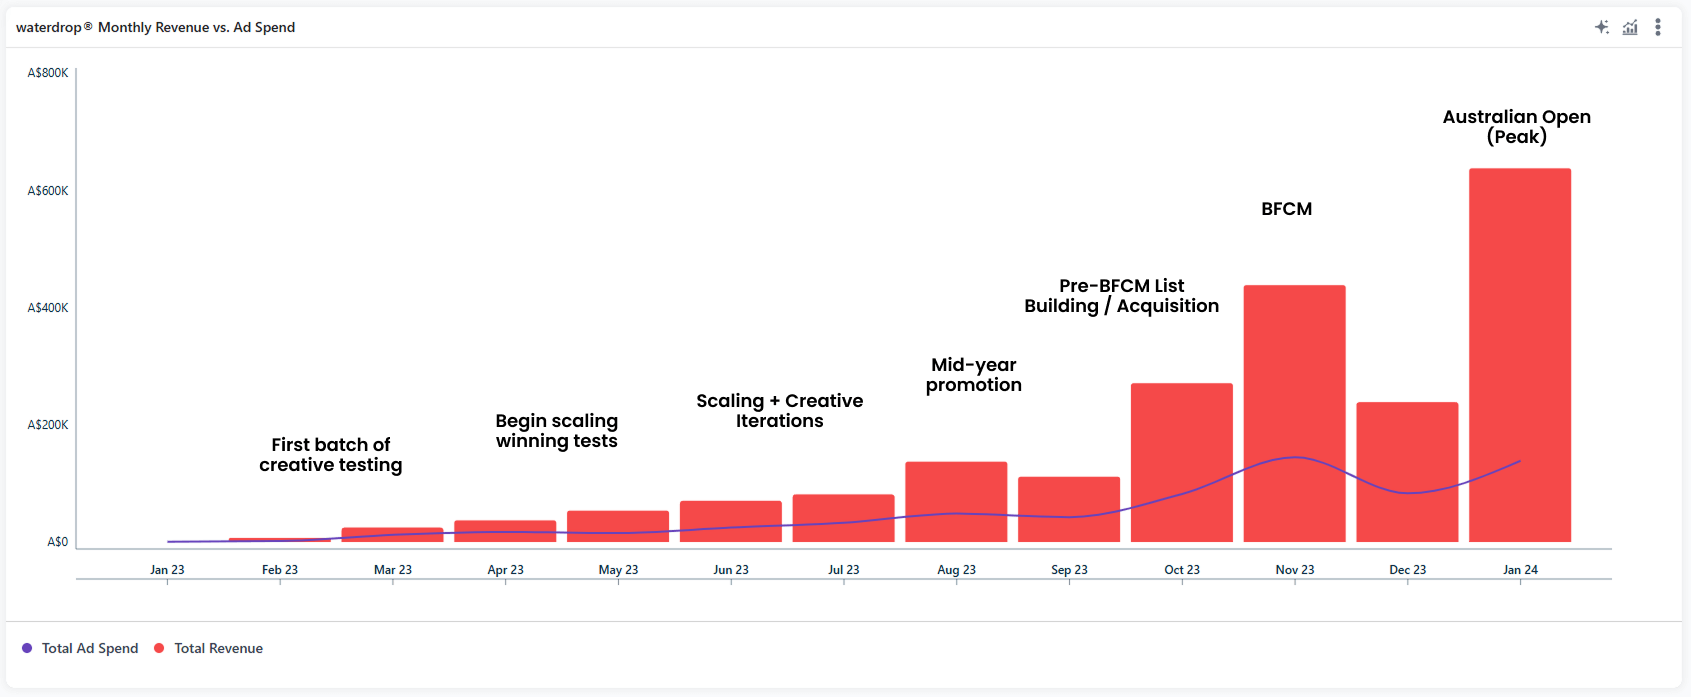
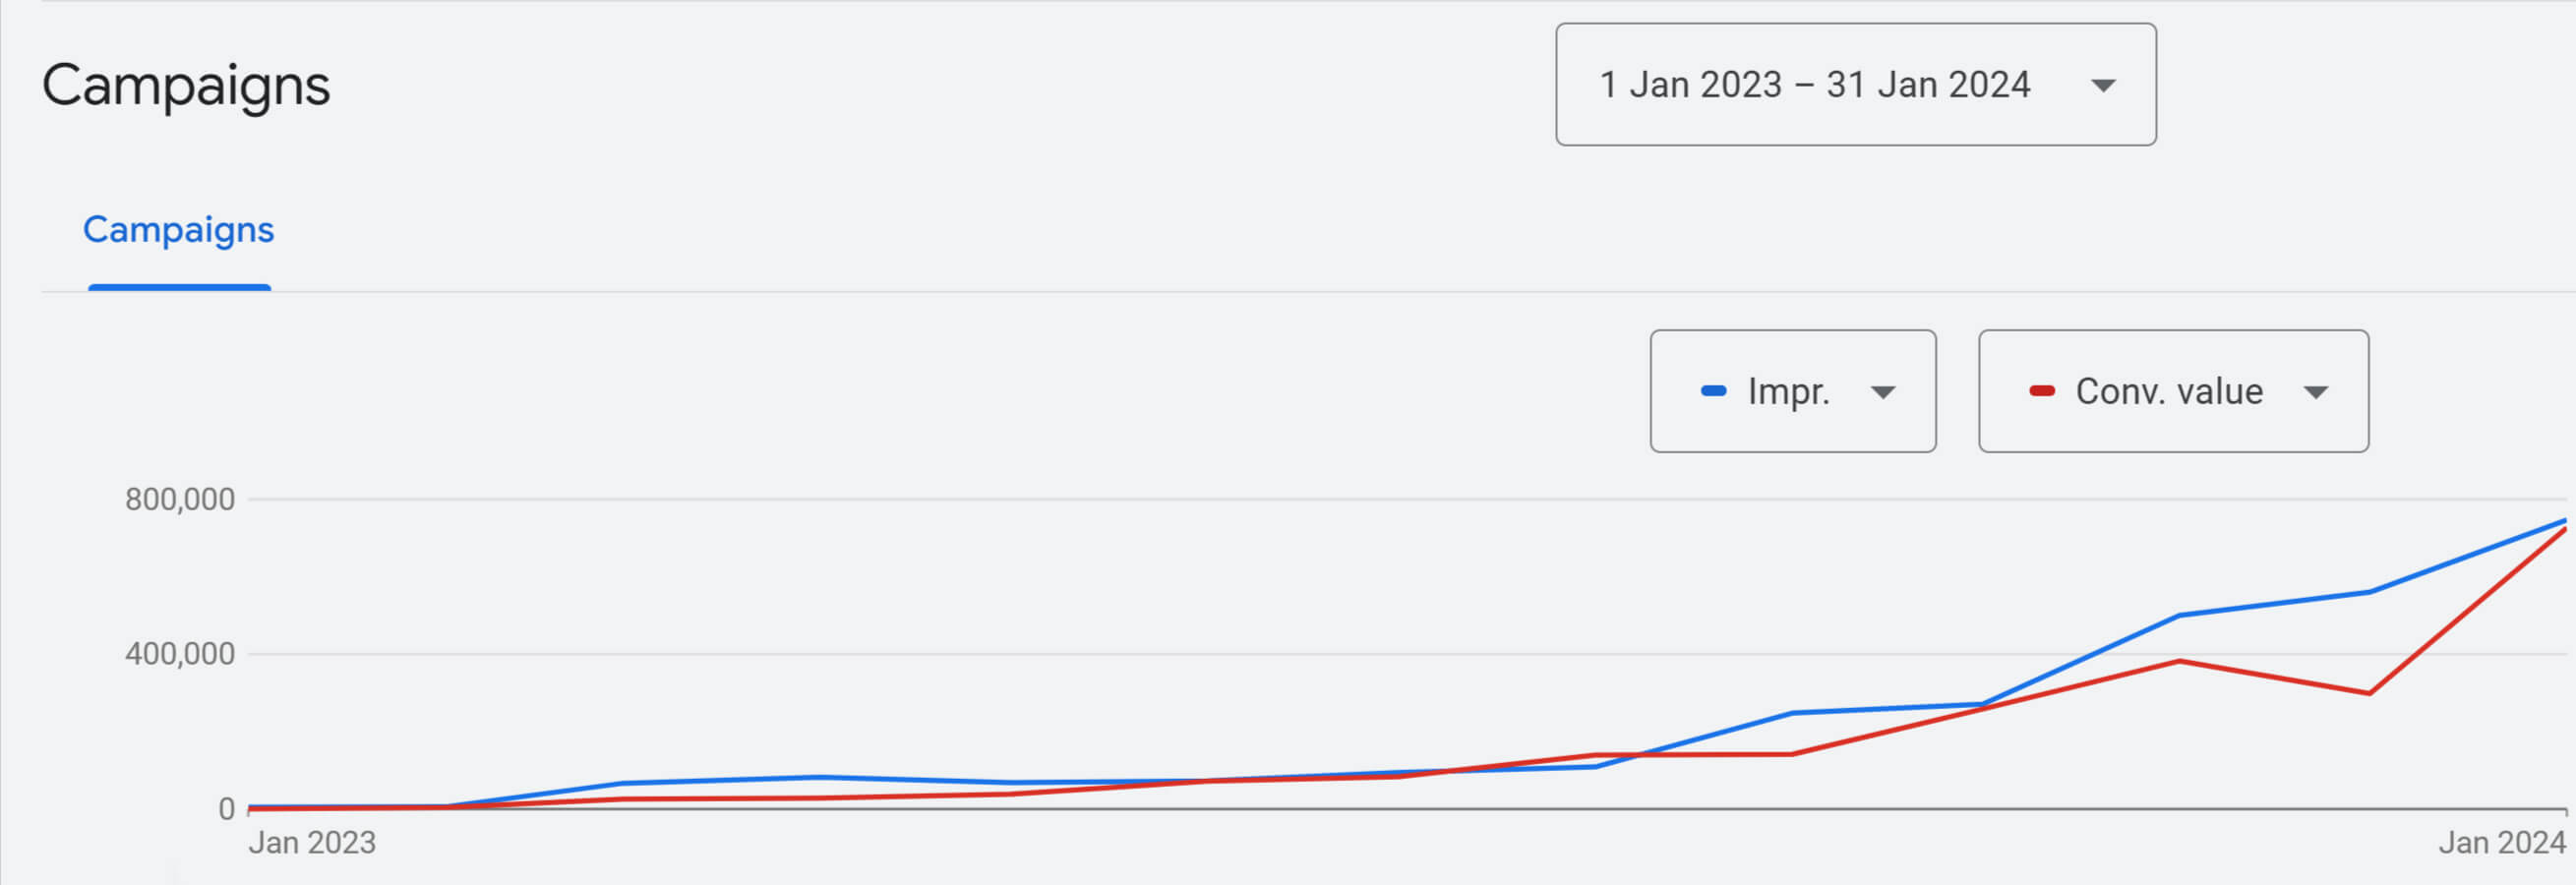
This wasn’t linear growth. This was compounding scale, guided by performance.
waterdrop’s Performance Timeline 2023-2024:
| Month | Revenue | Ad Spend | ROAS |
|---|---|---|---|
| Feb 2023 | $7,510 | $1,551 | 4.84 |
| Mar 2023 | $24,660 | $12,242 | 2.01 |
| Apr 2023 | $34,819 | $16,984 | 2.05 |
| May 2023 | $53,315 | $12,990 | 4.10 |
| Jun 2023 | $69,257 | $24,386 | 2.84 |
| Jul 2023 | $80,307 | $34,129 | 2.35 |
| Aug 2023 | $132,595 | $47,906 | 2.77 |
| Sep 2023 | $59,024 | $42,376 | 1.39 |
| Oct 2023 | $475,836 | $81,920 | 5.81 |
| Nov 2023 | $864,256 | $144,639 | 5.97 |
| Dec 2023 | $488,399 | $83,031 | 5.88 |
| Jan 2024 | $1,136,429 | $138,577 | 8.20 |
| Feb 2024 | $973,636 | $175,209 | 5.56 |
Summary
In under 12 months, waterdrop grew from launch to generating $1M/month in revenue, without burning cash, discounting heavily or relying on hacks.
How? A disciplined, full-funnel eCommerce growth system grounded in creative science, platform strategy, lifecycle marketing and data-led attribution. Built and executed by Webprofits, this framework prioritised predictable acquisition and
long-term retention, backed by performance data, not guesswork. As a result, the waterdrop now has:
- A creative engine that consistently produces scalable, high-performing assets
- A full-funnel media structure that captures demand across Meta, Google and Klaviyo
- Attribution infrastructure that enables confident six-figure monthly ad spend
- A lifecycle strategy that turns new customers into high-LTV repeat buyers
But this isn’t the end, it’s the baseline.
The future for waterdrop
The work done in the first instrumental year has set the foundation for what comes next:
- Aggressive scale: With clean data, a diversified creative pipeline, and channel synergy in place, the brand is positioned to confidently scale past current spend thresholds without sacrificing efficiency.
- Market leadership: waterdrop is carving out a new category in Australia. With awareness building, retail expansion and DTC momentum aligned, they’re on track to dominate the hydration space in both performance and brand.
- International leverage: The Australian playbook now serves as a proven model that can be replicated in other high-potential markets. Everything is in place: infrastructure, creative, strategy and data clarity.
waterdrop isn’t just scaling faster, they’re scaling smarter. And that’s what turns growth into dominance.
5 Key Takeaways You Can Apply Right Now
- Creative is your #1 performance lever. Build a testing engine, not a guesswork machine.
- Don’t scale without knowing your breakeven ROAS. Profit lives on the backend—track it obsessively.
- Meta creates demand. Google harvests it. Email/SMS monetises it. Use them in concert, not isolation.
- Attribution isn’t optional at scale. Invest in a truth-layer early or you’ll stall budget decisions.
- Retention is the margin multiplier. Build Flows that drive revenue on autopilot and convert one-time customers into brand loyalists—without heavy discounts.
Want to Scale Like This?
This strategy works for brands that:
- Manufacture their own products
- Have AOVs between $70–$150
- Sell consumables or products with strong LTV
- Are ready to scale, but need a proven system
If this sounds like your brand and you’re serious about scaling, contact us now to get started at [email protected]
Frequently Asked Questions
If you’re consistently generating sales, have product-market fit and strong contribution margins, you may be ready to scale. Brands often reach this point around $50K–$200K/month in revenue. We help confirm this with a growth-readiness audit.
The best way to scale profitably is to align paid media, lifecycle marketing, creative and margin visibility into one performance strategy. At Webprofits, we focus on new vs returning segmentation, use attribution tools like Triple Whale and scale what works — profitably.
Meta Ads, Google Ads, Klaviyo email/SMS and TikTok are core channels for growth. Channel mix depends on your customer, product and creative strengths. We help you focus on the channels that drive profitable scale.
It typically takes 30–60 days to stabilise performance, and 90–120 days to hit real scale. The speed depends on your existing data, creative assets and how quickly we can build a conversion engine.
The top-performing creative formats are UGC, reviews, product demos, founder videos, and before-and-after transformations. We’ve tested $17M+ in creative to find what scales fastest by product type.
We track contribution margin by product, use customer segmentation in ad accounts, and monitor real-time performance with tools like Triple Whale. Scaling only works if profit scales too.
Most growth-focused brands invest 10–20% of revenue into paid media. A typical scaling budget starts at $50K/month but your CAC, LTV, and margin profile will determine the exact range.
Yes. Many of our clients sell DTC and in retail. We structure campaigns and lifecycle flows to support both, driving online sales while improving retail sell-through velocity.
At Webprofits we focus on scaling profitably. Our agency is built around performance tools (Triple Whale, Klaviyo), proven creative systems and deep experience with $50K–$500K+/month brands.
Start by testing 3–5 creative concepts using UGC, reviews and demos. Use Advantage+ campaigns for efficiency, and segment new vs. returning customer campaigns. Pair this with Klaviyo flows to monetise traffic. We’ve scaled dozens of Shopify brands this way.
Use email/SMS flows (welcome, post-purchase, replenishment, winback), personalised offers, loyalty programs and targeted remarketing. We help brands increase LTV by optimising lifecycle touchpoints across channels.
Focus on creative testing, better audience segmentation, product bundling, and improving your onsite conversion rate. Reducing CAC is often about optimising upstream creative and downstream conversion, not just media cost.
Essential flows include: Welcome Series, Abandoned Cart, Browse Abandonment, Post-Purchase, Cross-Sell/Upsell, Winback, and Replenishment. These drive LTV and monetise traffic efficiently. We build and test these using Klaviyo.
Creative is the biggest lever in performance. We recommend launching 15–30 new creative variations per month, across UGC, reviews, statics, and motion edits. Testing volume is what finds winners and winners drive scale.
We monitor key signals like new customer CAC, contribution margin, ROAS trend and blended MER. If performance is stable and margins hold, we push budget. If not, we optimise before scaling further.
Creative fatigue is real… and expensive. We test anywhere between 20-100+ new creatives monthly across formats (UGC, static, motion) to stay ahead of fatigue and keep performance fresh.